
Surface Animation Toolbar
To display this toolbar:
-
Display the Visualize task bar and select a Models or Surfaces option.
-
Define the scope of the data to be visualized.
-
Click OK to create the mining surfaces and display them in the 3D window with the Surface Animation toolbar beneath.
Strategic planning surface data generated by the optimization workflow can be visualized in the primary 3D window and any linked windows.
Data is generated on-demand; when you click a link in the Surfaces section of the Visualize tab (Tasks Pane), depending on the selected type (pushbacks, pit periods, risk rated pits, pit shells and so on) a Show Surface Options screen may be displayed. This is used to control the surface(s) to be generated in the 3D window during animation playback.
After one or more surfaces have been specified, the 3D window is displayed and the wireframe representing the first value of the display attribute associated with the data type, for example the first "Pit" attribute value, is loaded into the 3D window.
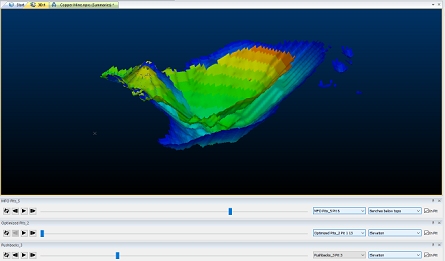
Visualized mining surfaces and associated Surface Animation toolbars
An Animation toolbar associated with each surface type is displayed at the bottom of the 3D window. One or more toolbars may be displayed, and each can control the rendering of each loaded planning surface type.
For example, you can animate your pit shells independently of your pushback wireframes.
Loaded surface data will appear in the Project Data control
bar's 3D folder, in a Managed sub-folder, for example: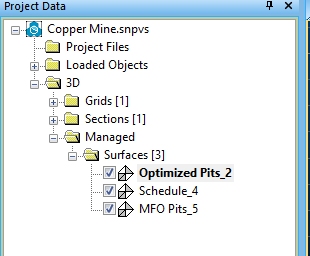
Each loaded surface will be represented by its own Animation tool bar.
Note: You can move, close, dock and
float animation tool bars as any other toolbar.
Toolbar Functions
All Animation tool bars for all surface types have the same layout:

- Make animation loop: disabled by default, if enabled a played animation will loop from the start when it reaches the end. Looping animations will continue until stopped.
- Rewind animation: show the previous surface in the animation range (if possible, disabled for first frame)
- Play animation: step through each surface in the animation range automatically. This will either stop when it reaches the end (looping off) or continue until stopped (looping on).
- Fast forward animation: show the next value in the animation sequence and update the 3D display.
- Animation slider: move backward and forward through all animation values using the mouse.
- Select animation frame: choose the description of the animation frame you wish to see, using this drop-down list. This will automatically update the slider position (see above).
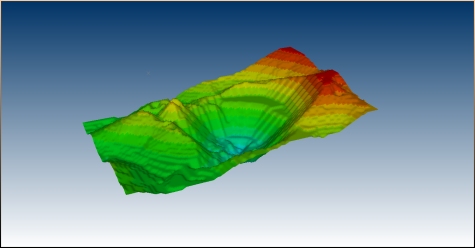
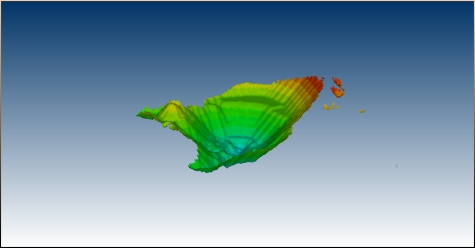
- Choose the display legend: choose from:
- Elevation – Display the surface in a blue-red colour transition from lowest
to highest elevation, like this:
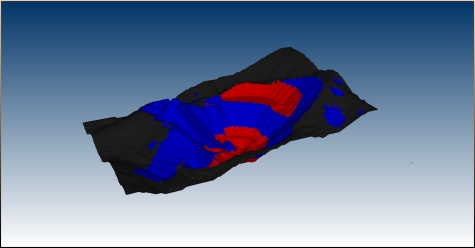
- Benches
below topo – Display clearly defined benches above and
below the topography associated with your planning project, like this:
- Benches
below last – Highlight all benches that are below the
previous surface in the animation sequence, like this:
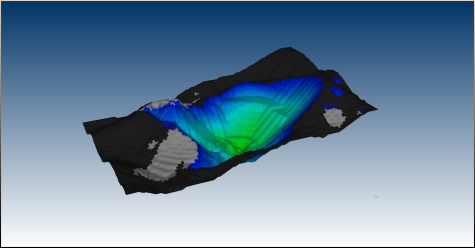
- Show
in-pit data – If selected, only the data that is within
the pit will be displayed, filtering out other surface data,
for example:
Related topics and activities: